
IT development in Ukraine: Current situation and prospects
фінансовий аналітик YouControl, д.е.н., професор КНЕУ

The information technology (IT) sector has attracted public attention for several decades, becoming a separate economic and sociocultural phenomenon in Ukraine. Traditionally, the hype around IT has been driven not only by relatively high average salaries in foreign currency and a low entry threshold for active young people but also by rapid annual revenue growth and a strong export orientation. It means that IT as a segment is highly solvent, particularly in the opinion of bankers and realtors.
However, despite the resilience demonstrated by the IT market at the initial stage of the full-scale war, in 2023, disappointing signals began to emerge about the deterioration in some indicators of recruitment, business activity, and the financial status of the IT market. Open data analysis allows us to understand what is happening with the IT market economy, which companies hold leading positions in revenue, and which regions of Ukraine remain the most promising for IT business.
Using the YC.Market tool, YouControl Financial Analyst Roman Kornyliuk, has prepared a sectoral study of the main changes and new trends in the economic development of the Ukrainian IT market during the full-scale war.
Our method of calculation
To form the sample of the study, we selected all operating companies in Ukraine with non-zero net revenue for 2022, whose main activity corresponds to the list of the following IT NACE codes:
- 58.21 Publishing of computer games
- 58.29 Other software publishing
- 62.01 Computer programming activities
- 62.02 Computer consultancy activities
- 62.03 Computer facilities management activities
- 62.09 Other information technology and computer service activities
- 63.11 Data processing, hosting and related activities
- 63.12 Web portals
Read more on the topic: https://blog.youcontrol.market/kataloghi-vid-yc-market-povnii-oghliad-biznies-landshaftu-ukrayini/
To ensure the dataset is complete and comprehensive, we've included IT companies with "non-standard" NACE codes, including some Ukrainian developers, importers and software traders with the main specialisation of 18.20 Reproduction of recorded media; 46.51 Wholesale of computers, computer peripheral equipment and software and others.
What is happening with the export of IT services?
The aggressive full-scale invasion of Russia stopped the rapid growth of IT services exports.
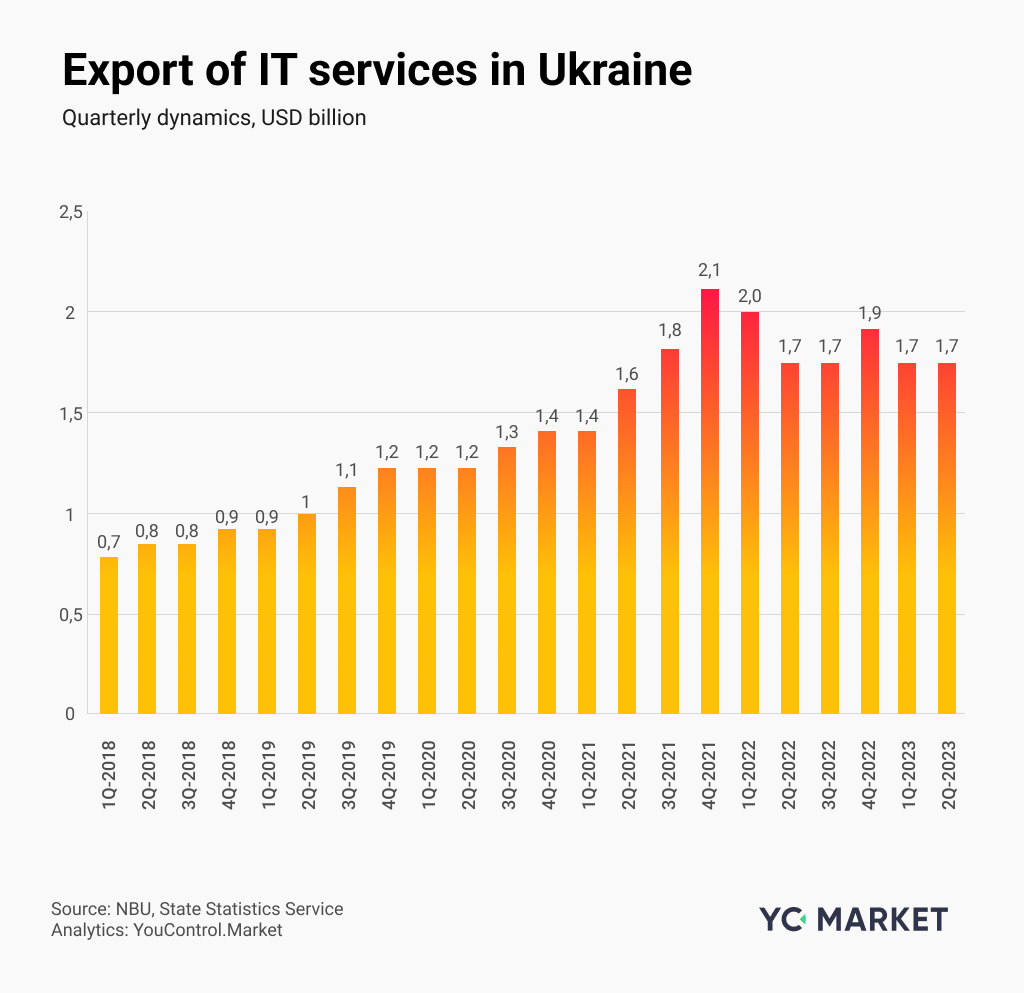
*credit of the balance of payments item "Computer services" (according to BPM6)
(Data: NBU, State Statistics Service. Analytics: YC.Market)
As can be seen from the quarterly export dynamics graph, this IT activity indicator reached its peak on the eve of the Russian invasion in Q4 2021, when USD 2.1 billion was imported into the country. Since then, average exports of computer services have gradually dropped to USD 1.7 billion, meaning that the drawdown in quarterly IT export revenue has been about -20%.
Although the sector's share in Ukraine's total exports of goods and services has increased from 8.8% to 13.4% over the year and a half of war, the IT sector is still far from being seen as the driving force behind export capacity growth, as optimistic expectations were before the war.
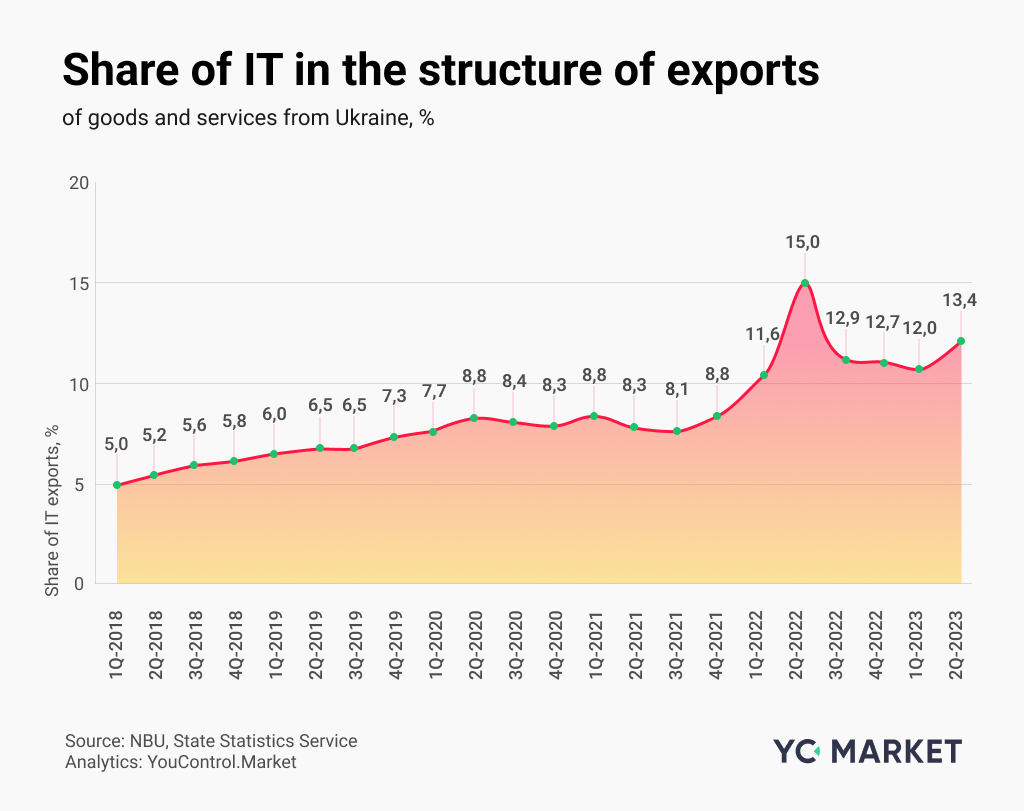
The growth in the contribution of computer services is primarily due to an even more significant decline in agro-industrial goods in total exports. The driving force behind rising absolute volumes of foreign currency IT revenue sharply halted in 2022, and it will take time to restore the previous growth rates (even if uncertainty and external threats are overcome).
Where is the IT business concentrated in Ukraine?
Two-thirds of the total net revenue declared by Ukrainian IT companies in 2022 was concentrated in the capital of Ukraine – UAH 123.7 billion out of UAH 184.4 billion. In Kyiv, 3,013 (52.4%) IT companies with known non-zero revenues generated in 2022, the first year of the war, are officially registered.
With a significant gap from the capital, the IT map of Ukraine shows such poles of concentration of IT business as Lvivska (10.4% of revenues), Kharkivska (8.1%), Dnipropetrovska (4.2%), Vinnytska (3.4%), and Odeska (1.7%) oblasts.
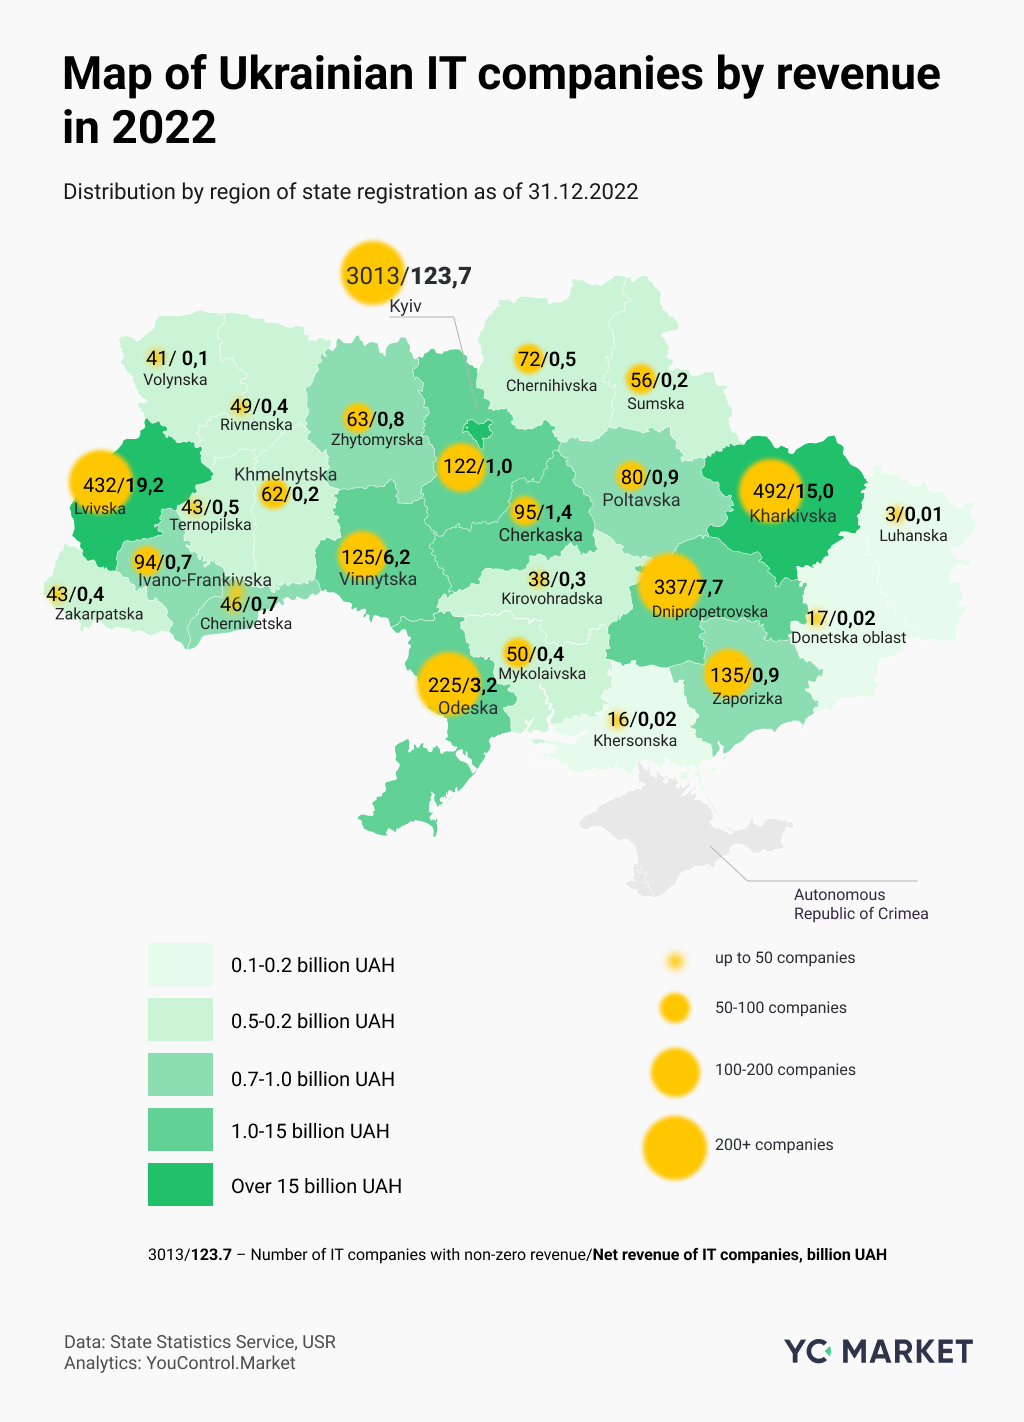
In 2022, the lowest net revenue from sales was declared by IT companies in regions with a significant share of temporarily occupied territories: Luhanska, Donetska and Khersonska oblasts.
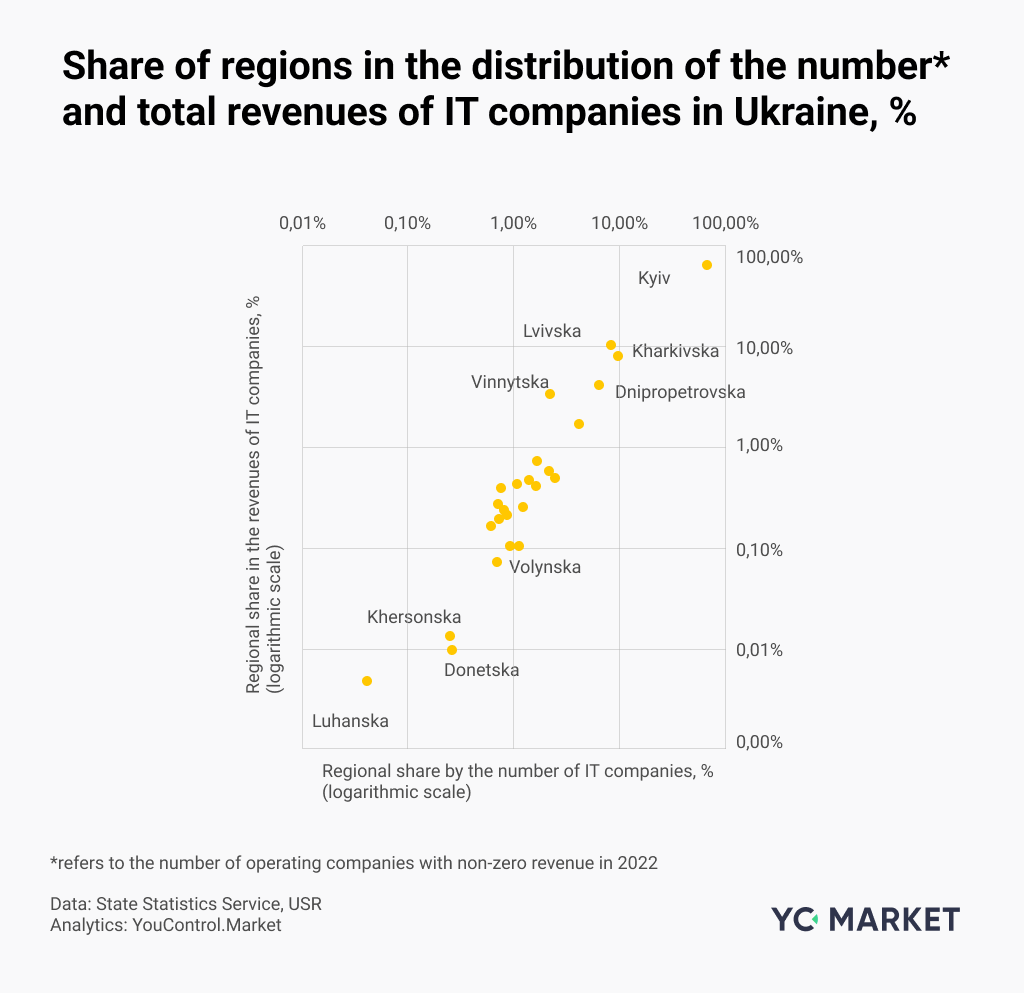
The ranking of regions by the number of companies with non-zero revenues in 2022, with few exceptions, generally coincides with the ranking of regions by total IT business revenues. Kyivska (3,000 companies), Kharkivska (492), and Lvivska (432) oblasts are the top three in number of active IT companies. Over a hundred companies with non-zero revenues are registered in major cities in the following regions: Dnipropetrovska, Odeska, Zaporizka, Vinnytska, and Kyivska. The smallest number of IT companies was found in South-Eastern Ukraine's temporarily occupied and frontline regions.
The location and concentration of business activity in the IT sector in Ukraine are influenced by traditional factors that form the poles of economic growth:
- Concentration of educational and research centres in cities with a population of over a million and 100,000 people, which ensures a constant inflow of technically educated and English-speaking specialists to the sector
- Critical amount of backbone foreign or local IT companies that generate demand in the labour market, ensure a continuous flow of high-paying orders due to their high capitalisation and become socially responsible cores of regional IT clusters
- Development of the city's IT ecosystem based on a group of interested participants and stakeholders around shared interests and scale-wide cost savings, including co-financing of educational and infrastructure initiatives and even collective protection against raiding or unmotivated abuse of power by regulators
- Proactive urban policy and a high level of urban comfort, which, in turn, can significantly enhance the resilience and scaling of the local IT ecosystem if the IT sector is considered by municipal authorities as a priority strategic direction of community development, not just in words, but in deeds.
A new limiting factor that caused the decline in IT activity and the relocation of existing businesses to safer regions was the negative impact of hostilities in the occupied and frontline areas.
YC.Market's previous analysis of the geographic shift of IT companies' revenue structure during the full-scale war revealed clear trends in the decline in the share of the regions most affected by the aggressor in Ukraine's total IT revenue. It includes a drop in the contribution to the sectoral business activity of Donetska, Zaporizka, Luhanska, Khersonska, and Kyivska oblasts, as recorded in the financial statements.
On the other hand, the role of Lvivska, Vinnytska, Ivano-Frankivska, and, surprisingly, Odeska and Kharkivska oblasts has increased. It is worth noting that this paradoxical regional result could be influenced by the success of several leading companies or the relocation of specialists without changing the "legal residence" of the companies.
Which IT companies have become market leaders in terms of revenue?
Based on the ranking of 5,749 IT companies by net revenue in 2022, we have identified the Top 25 IT companies. It is a ranking of legal entities based on official revenue, so IT brands with constellations of related companies and extensive networks of individual entrepreneurs received lower rankings than they would have hypothetically shown in the case of consolidation of financial statements.
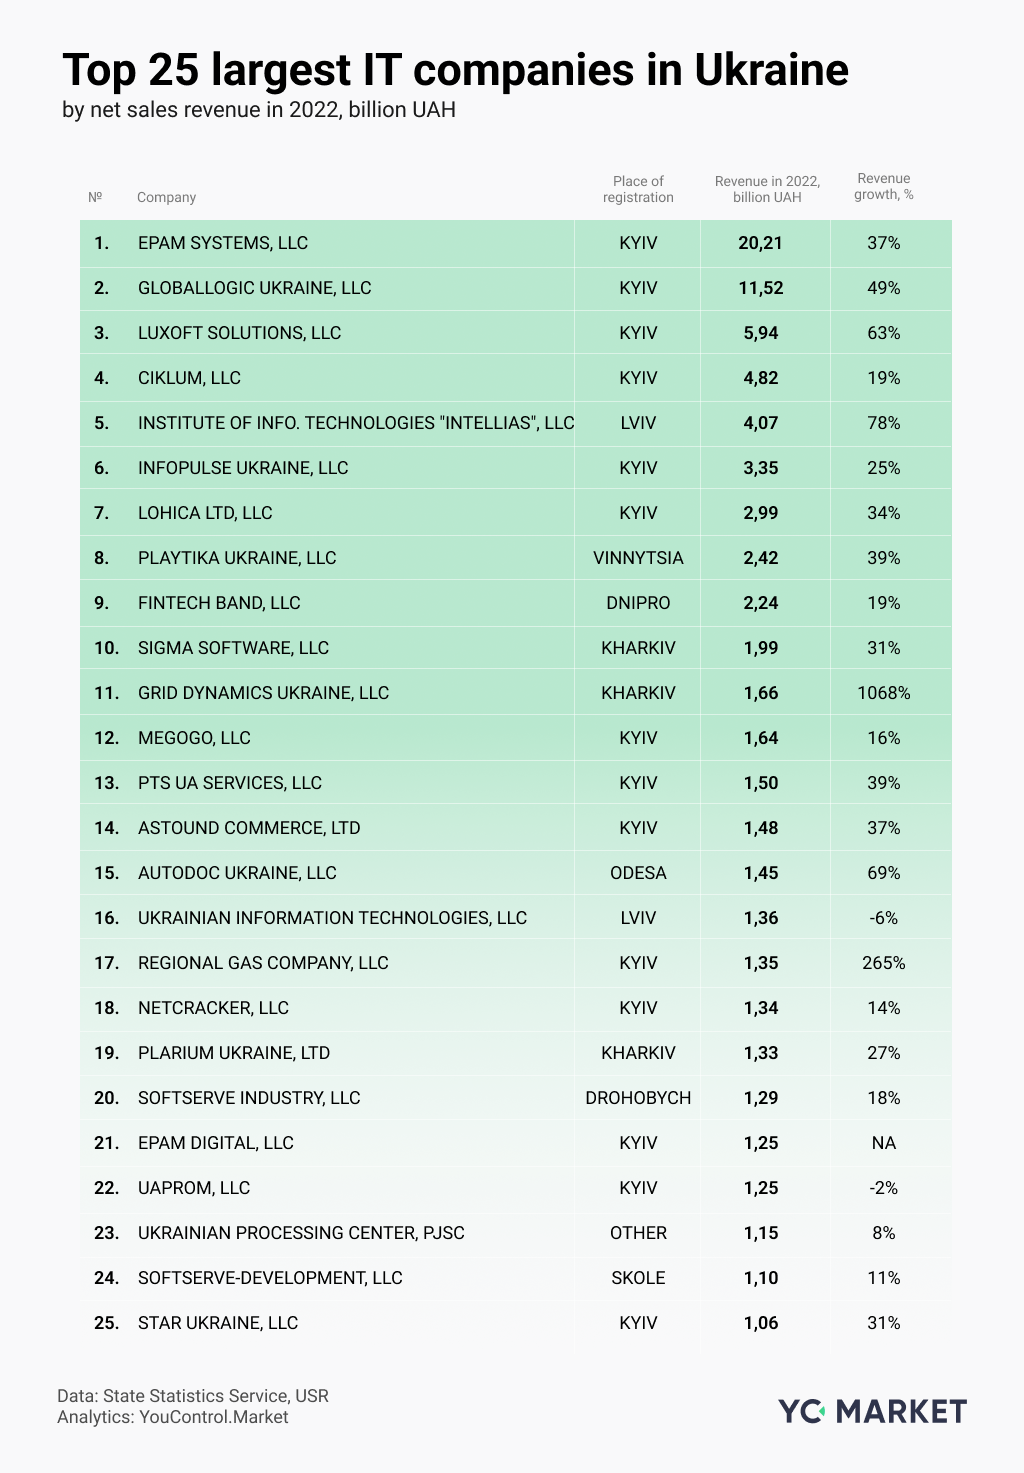
EPAM Systems, the holding's primary subsidiary in Ukraine, took first place with a declared net revenue of UAH 20 billion, up 37.5% compared to 2021. GlobalLogic Ukraine is in second place (net revenue of UAH 11.5 billion, +49%). Luxoft Solutions rounds out the top three (net revenue UAH 5.9 billion, +63%). The high growth rate of Hryvnia-denominated revenue during the first year of the war was driven by a high share of foreign currency revenues due to the external order structure of these global companies. Therefore, adjusted for the devaluation of the national currency in 2022, these growth rates will no longer look gigantic. They may fade against the backdrop of the growth successes of previous years.
Among some so-called "galleys" with an outsourced global business model, the Top 25 ranking also includes national product IT companies, including Fintech Band, LLC, which owns the Monobank fintech project, Megogo, LLC with the eponymous OTT media service in streaming media, or the largest marketplace in Ukraine, UAPROM, LLC.
How did IT business revenues change during the war?
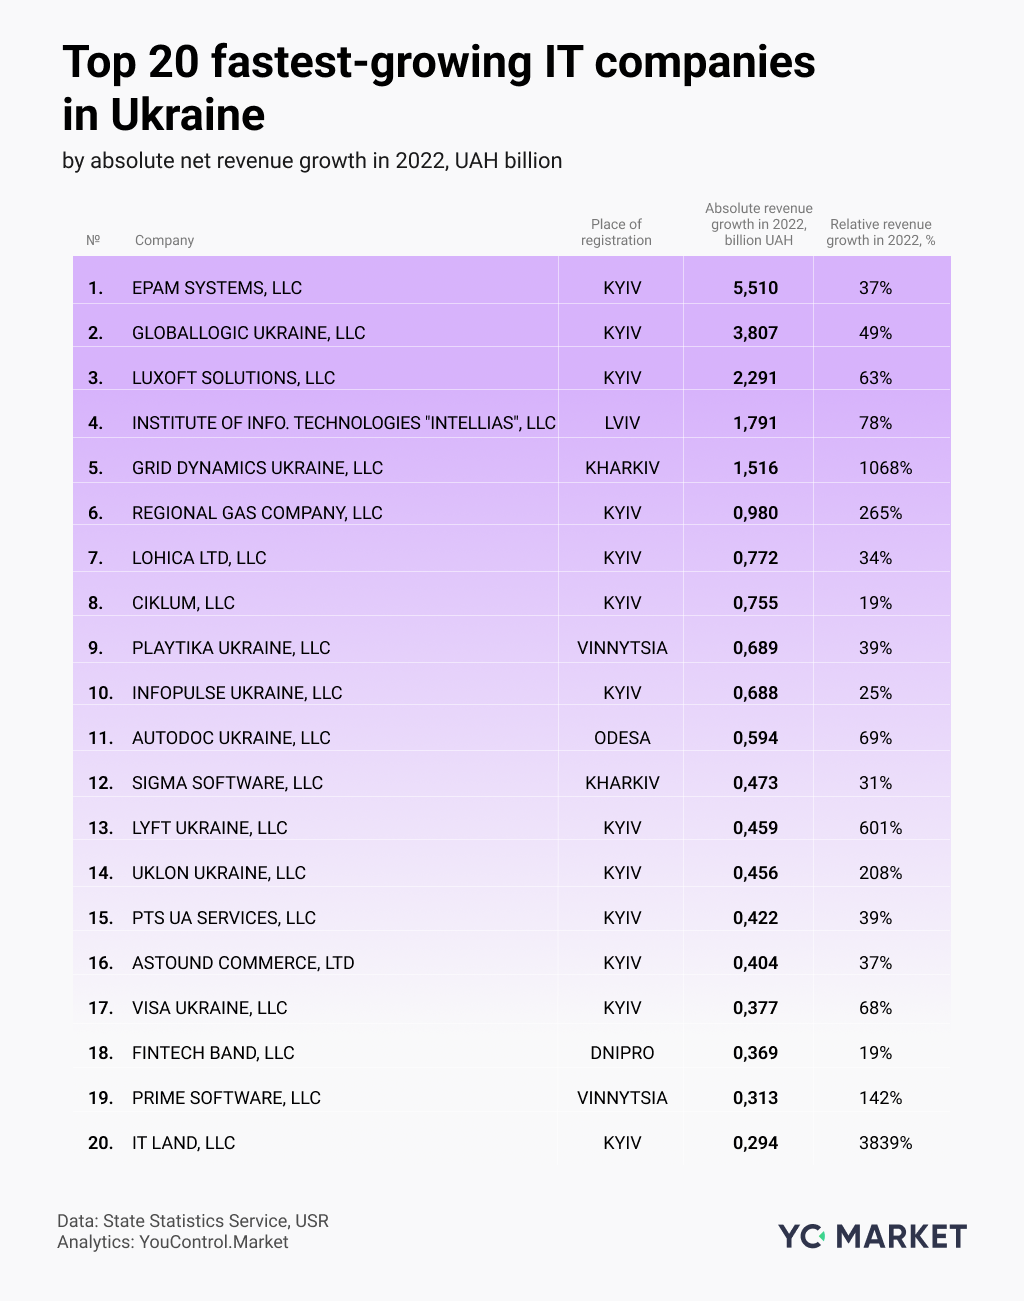
Let's look at the most dynamic companies regarding absolute revenue growth. The top three remain unchanged: EPAM Systems, GlobalLogic Ukraine, and Luxoft Solutions, which added +UAH 5.5, +3.8, and +UAH 2.3 billion to their revenue figures in 2021.
Moving on, the ranking of the most dynamic IT companies looks different. In particular, Lviv-based Intellias (+1.8 billion UAH, +79%) ranks 4th in terms of revenue growth, Grid Dynamics (+1.5 billion UAH, +1069%) is 5th, and Regional Gas Company from Kyiv is 6th (+1 billion UAH, +266% year-on-year).
How and where is the number of Ukrainian IT individual entrepreneurs growing?
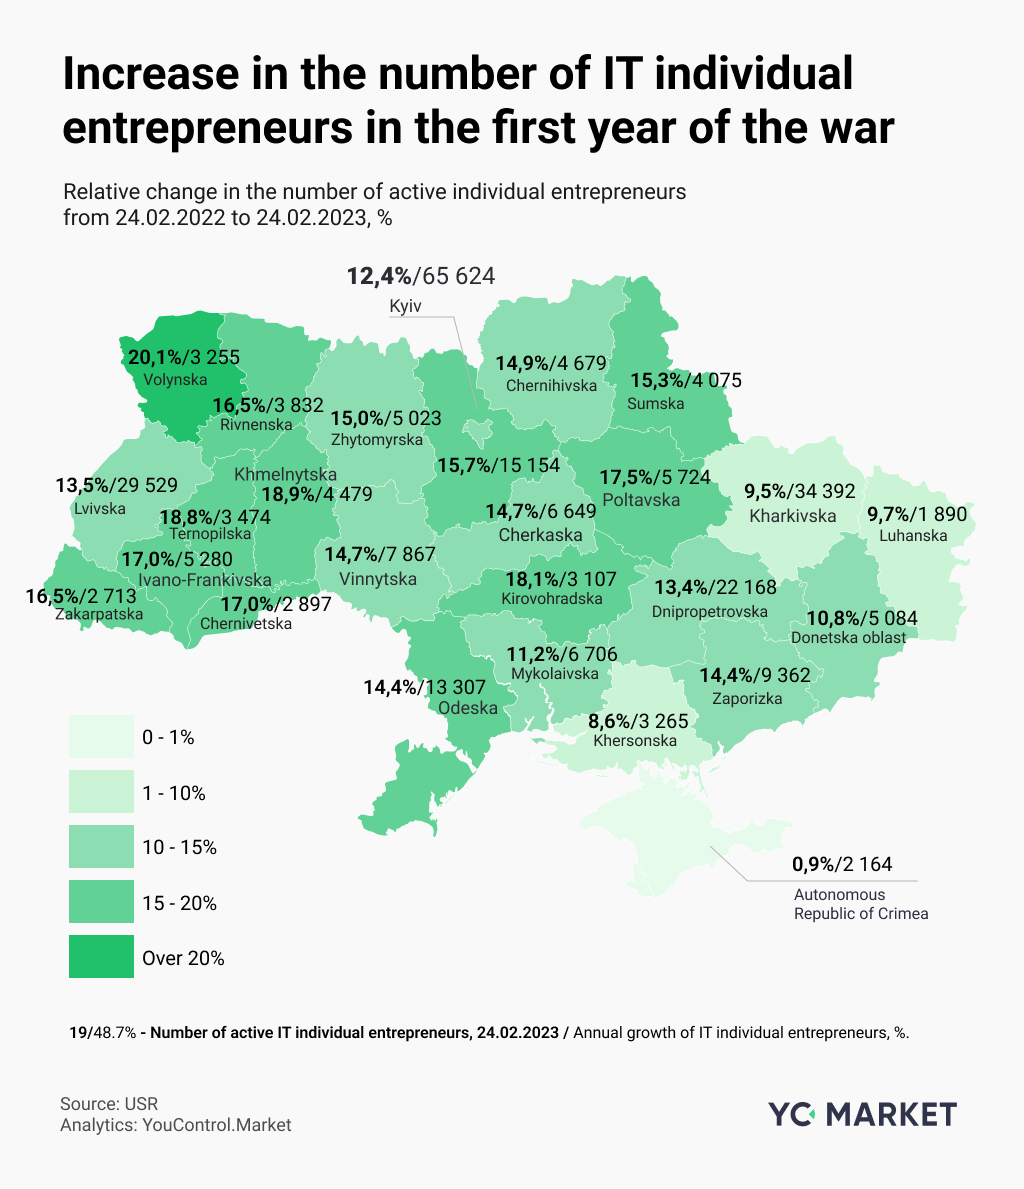
During the first year of the war, active IT individual entrepreneurs grew most rapidly in Volynska, Khmelnytska, Kirovohradska, Poltavska, Chernivetska, and Ivano-Frankivska oblasts. As we can see, high growth of IT individual entrepreneurs at 17-20% was observed in the western and central regions, which were relatively less affected by the enemy's aggressive actions.
The growth was minimal but still occurred in such fully or partially temporarily occupied regions of IT individual entrepreneurs as the Autonomous Republic of Crimea (+0.9%), Khersonska (+8.6%), Kharkivska (+9.5%), and Luhanska (9.7%) oblasts. It means that the number of de jure registered IT professionals increased even in the regions occupied by the enemy, primarily due to the registration of businesses in government-controlled areas by internally displaced persons with old residence permits.
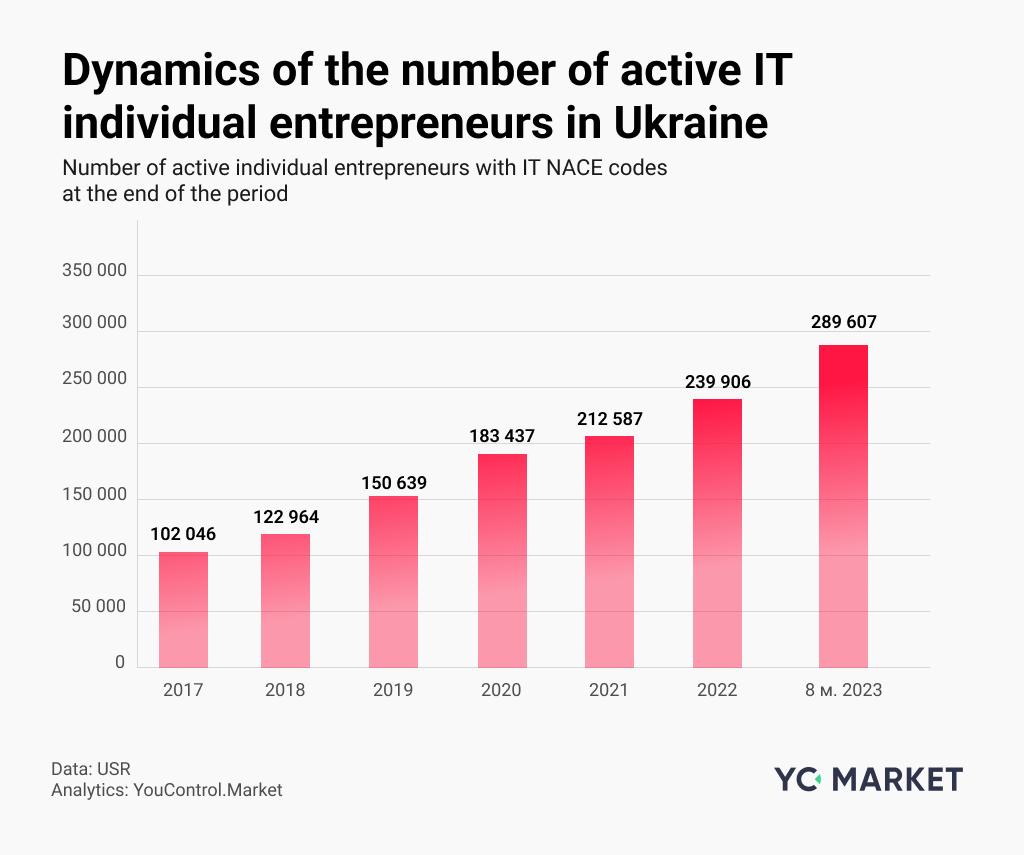
A significant number of legally active IT individual entrepreneurs have ceased operations due to factors such as moving abroad and a decrease in demand for their services, even with a long-deferred payment of the single tax under the zero reporting option, which for some time discouraged IT professionals from acknowledging the fact that they had ceased their business activities in the Ukrainian jurisdiction.
Thus, the popular message about the uninterrupted official growth of the number of individual entrepreneurs despite the challenges of wartime should be taken with a grain of salt. It is unlikely that the nominal growth rate of this indicator correctly reflects the market dynamics in IT, as evidenced by the negative trends in exports, as described above, as well as signals of an uncertain situation in the local labour market.
Thus, the nominal growth of specific indicators of the IT sector, including the official number of individual entrepreneurs or Hryvnia revenue, may hide rather disappointing trends in the destructive impact of military, political and macroeconomic factors on the industry, which has traditionally been considered a driver of the future success of the Ukrainian economy.
Our "IT bulldozer" has slowed down and is skidding. It should be acknowledged at the level of economic policy, with a more thorough understanding of the symptoms, systemic causes and forecast consequences, to develop ways out of the stagnation trap.