
Top 1,000 Ukrainian companies by revenue in 2022
фінансовий аналітик YouControl, д.е.н., професор КНЕУ
The thousand largest companies by revenue in 2022 generated almost 6 trillion UAH. Most of them belong to the energy and agriculture sectors. The majority of the Top enterprises are registered 15-30 years ago. Read about the sectoral and geographical analysis of the development of the largest enterprises and the main trends in key market segments in a joint study by financial analyst Roman Kornyliuk and YouControl R&D centre.
Following the publication of companies' financial statements for 2022 by the State Statistics Service in April, the media space was filled with various company rankings. That confirms the growing public interest in the topic and demonstrates the high demand of the business community for financial data disclosure. However, to understand the complete economic picture, such rankings require additional in-depth analysis of market signals, trends and anomalies.
YouControl experts have increased the scale of the research sample to 1,000 companies and accurately aggregated it by industry, region and age.
Revenues in the Oil and gas and Energy sectors exceeded 1 trillion UAH
Ukraine's largest companies on the list provide more than half of the total revenues of all businesses in the country. The most significant business sectors in terms of revenues are oil and gas (146 companies), the food industry (129), energy (105), and agriculture (102). The Top 50 companies, in terms of revenue, operate in sectors such as wholesale and retail trade, chemicals, and metallurgy.
The same industries are widely represented in the ranking above by revenue but in a different order. The oil and gas sector ranks first (1.3 trillion UAH or 21% of the total revenues of the Top 1,000), followed by energy (17.3%), then retail trade (8.3%), agriculture (8.1%), food industry (7.7%), and metallurgy (7%).
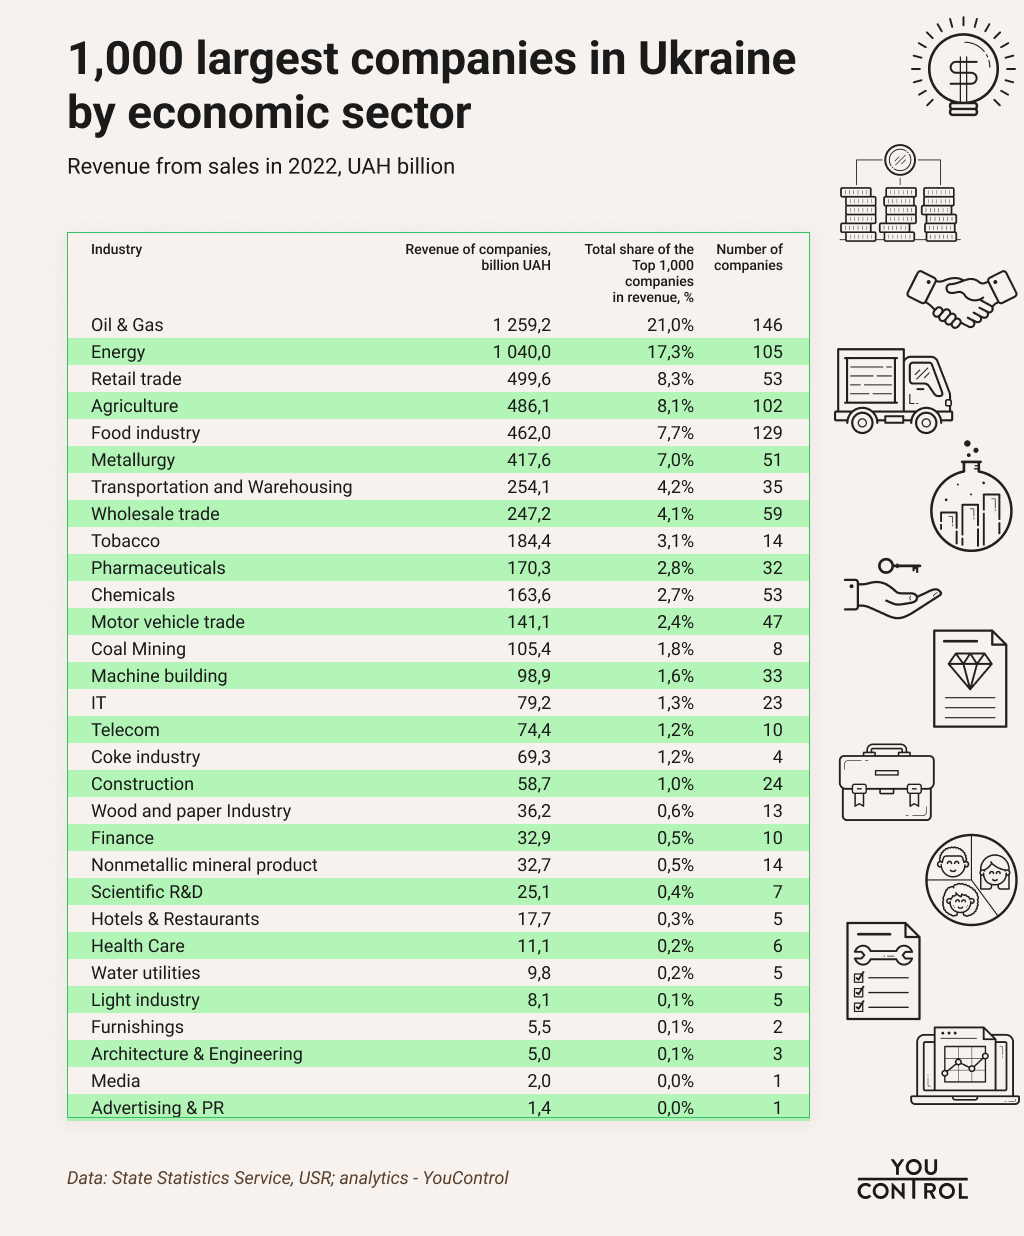
The coke industry, tobacco, coal mining, and metallurgy generate significantly higher revenue per enterprise despite the relatively lower number of large companies in the Top 1,000. The backbone of Ukraine's big business is still the industries that use natural resources.
Despite the obvious growth in the role of information technology, Ukraine's sectoral profile and export specialisation are still determined by the agriculture and food industries, as well as such heavy industries as metallurgy, chemicals and energy. The latter's role remains significant, despite the higher sensitivity to the hostilities' negative direct and indirect effects.
Concentration in the capital and industrial centres
About 51.5% of the total revenues of the Top 1,000 companies are concentrated in companies registered in Kyiv. In addition to 405 firms in Kyiv, another 26% of revenues are generated by 259 large enterprises that are legally located in the industrial centres of Dnipropetrovska, Kyivska, Lvivska and Odeska oblasts. As a result of the Russian aggression, the share of the traditional leaders of last year's rankings – Kharkivska and Donetska oblasts – in total revenues has significantly decreased to 11-12th place: 1.6% and 1.3% of total revenues, respectively.
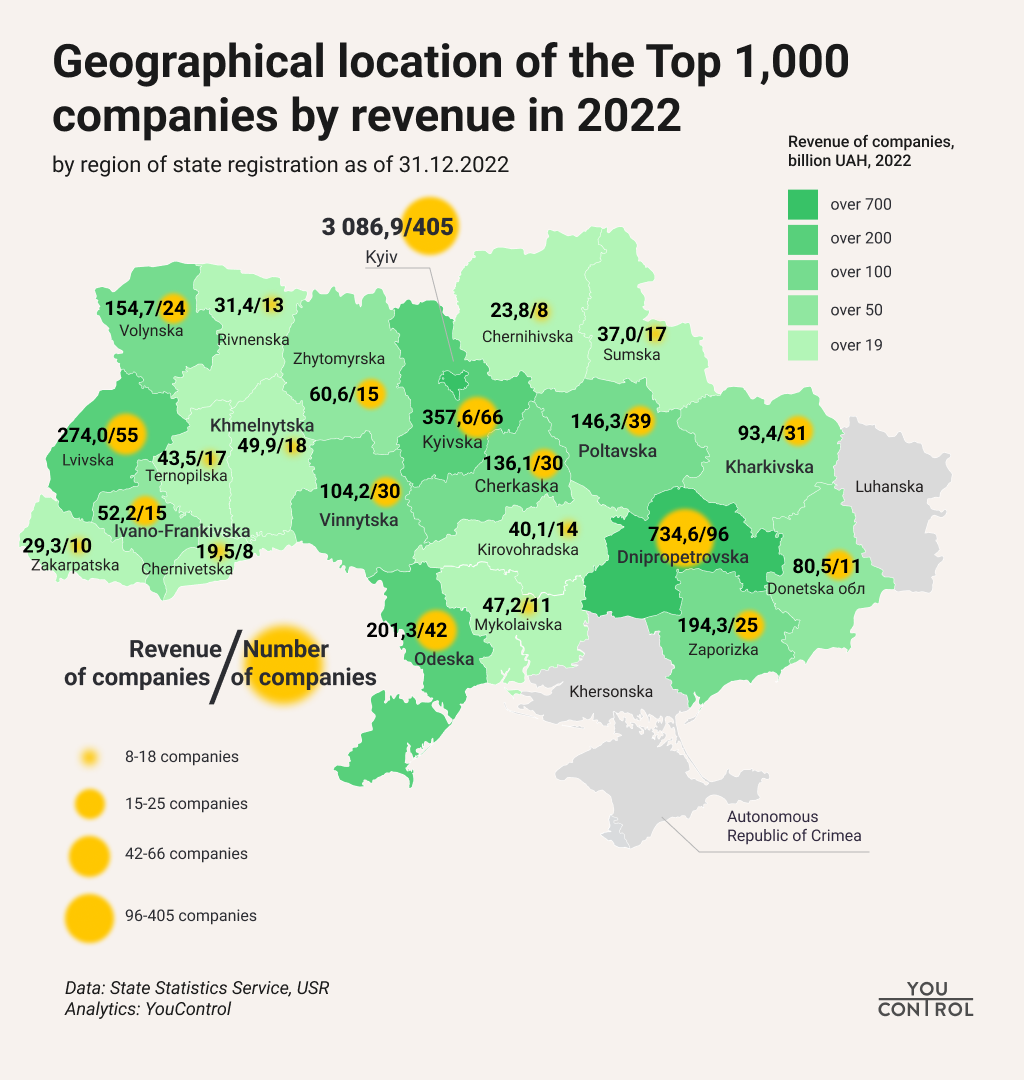
Further, the list of regions of registration of companies included in the ranking consists of Zaporizka, Volynska, Poltavska and Cherkaska oblasts.
The smallest number of large companies is located in Zakarpatska (10), Chernihivska (8) and Chernivetska (8) oblasts.
The geographical structure of large businesses location underwent tectonic shifts in 2022. The attachment of large operating companies to powerful industrial and financial centres remains only in areas far from the frontline. At the same time, Kharkivska, Donetska, Luhanska, and Khersonska oblasts suffered significant business activity losses due to the war.
The relocation, reduction or complete suspension of business activity of billionaire companies from the urban agglomerations of Kharkiv, Kramatorsk, Avdiivka or the occupied Sievierodonetsk, Lysychansk, Mariupol, and others, compounded the traditional stagnation of many depressed rural areas.
Despite the catastrophic impact of the war on big business in the South and East, it is encouraging to see that the positions of Top companies from Dnipro, Zaporizhzhia and Odesa on the country's business map remain as stable as possible in the current circumstances.
Top companies with a twenty-year history
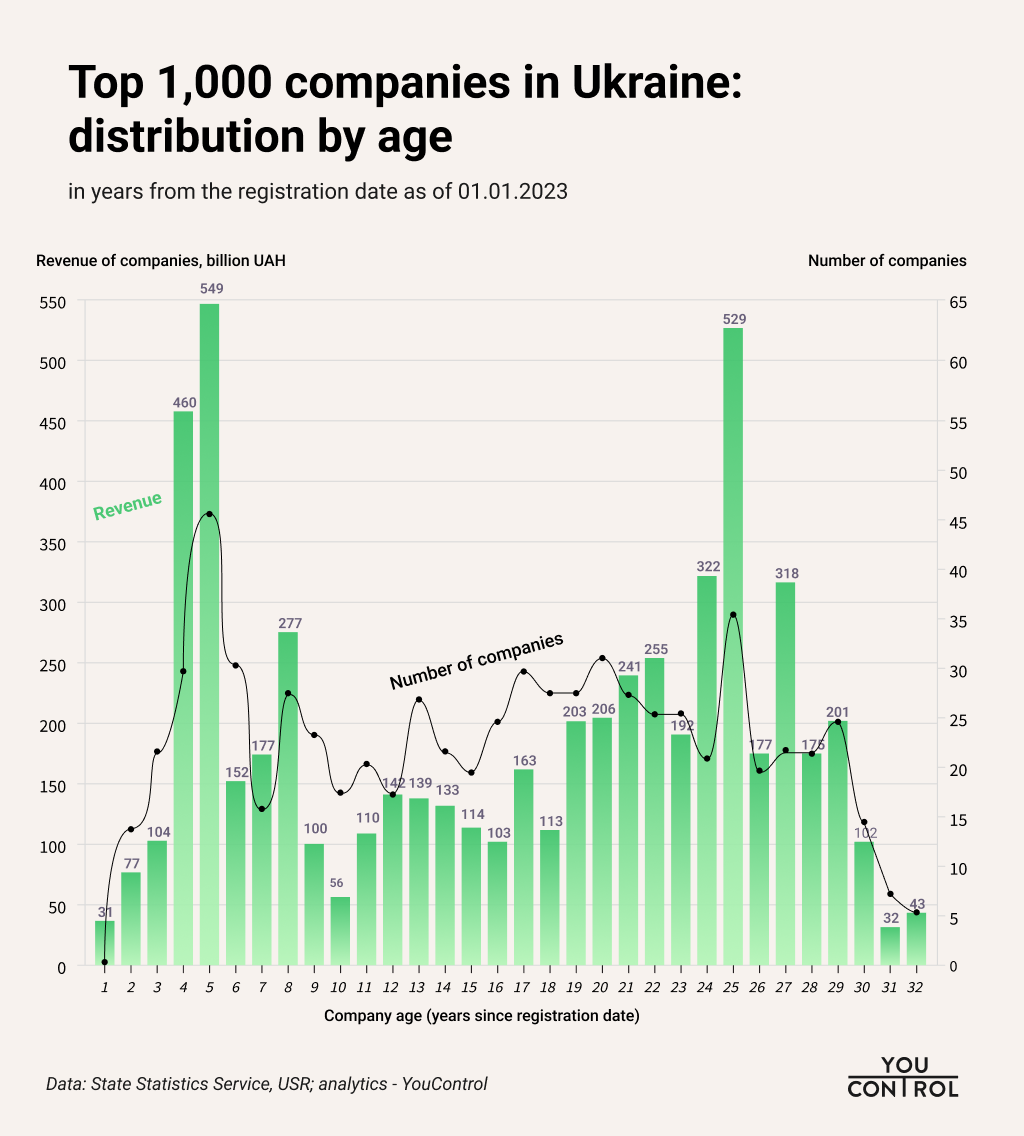
The age distribution of Ukraine's 1,000 largest companies looks relatively even. However, we can see several noticeable patterns if we look at these companies' revenue for each year since their registration date.
Most Top 1,000 are old companies registered 15-29 years ago. Young companies aged 4-5 years also show high revenues. However, many re-registered firms among the newly established companies quickly started generating billions in revenue. Their shareholders tend to register such companies as part of the business structuring of financial-industrial groups and reorganisation of state-owned enterprises with monopoly features. Often, the revenues of such companies are closely linked to regulatory decisions and the proximity of their owners to political elites.
The third factor that affects the revenues of Ukraine's largest companies is periods of change in presidential power in the country. Local revenue peaks correspond to the years of company registration that coincide with this change. That may be due to the practice of "covering their tracks" by liquidating old companies with troubled judicial or financial history and creating formally clean companies "from scratch".
The average age of companies varies considerably depending on their industry. The youngest companies are in the energy, oil and gas, hotels and restaurants, and architecture and engineering sectors, with an average age of 7 to 9 years from state registration. The oldest companies are in the scientific R&D, furnishings, water utilities, and coke industries, with an average age of 24 to 29 years.
In the nonmetallic mineral product sector, pharmaceuticals, machine building and metallurgy, the average age of the largest companies is 19-23 years. Many of them inherited their material base from the Soviet-era capital infrastructure. The registration dates of these companies are related to the period after the large-scale privatisation in the late 1990s and early 2000s.
Calm 2020 vs turbulent 2022: who survived and made it to the Top rankings?
Our research is the second update of the ranking of the largest companies. After all, YouControl presented its first analysis of the Top 1,000 companies two years ago, based on 2020 data. However, the administrators' disclosure of official reports for 2021 has deteriorated in terms of relevance, completeness and accuracy of the data. Therefore, given the poorer quality of historical financial statistics in 2021, it was more accurate to use the data from the year before 2020 as a basis for a realistic comparison of changes in the sectoral and regional structure in the military year 2022.
Assessing the members of the largest companies in Ukraine in 2022 with the Top companies in 2020, YouControl experts determined that the composition of the first thousand was updated by 27%. Therefore, over the past two years, 271 companies have left the ranking of the first thousand large businesses, mainly due to falling revenues, partly due to bankruptcies and destruction, and some operating companies may not have disclosed their financial data yet.
Compared to the results of 2020, the Top 1,000 companies in 2022 were completely eliminated from the list of companies from the following sectors of the economy: Real Estate, Tourism, Sports activities and Amusement and recreation activities. As a result, none of the companies in these sectors made it to the Top 1,000 by revenue. These structural changes accurately reflect the war realities when most citizens do not have time for the Top-level needs of Maslow's pyramid, such as entertainment, sports or tourism, which led to a drop in demand for these services. The real estate market also declined significantly, especially in the first half of last year, which did not help Top realtors to increase their revenue.
Companies' revenues in 2022 grew moderately in nominal terms. The total revenue of the largest companies amounted to almost 6 trillion UAH, which is 20% more than the total revenue of the Top 1,000 companies in Ukraine in 2020 (5 trillion UAH). However, such a nominal increase is hardly a reason to draw positive conclusions given the consumer inflation rate of 26.6%, which completely "ate up" all this illusory growth last year, eloquently indicating an actual drop in the amount of real income of large businesses.
Metallurgy stands out among the markets that saw major players' most significant revenue drop. Due to a drop in last year's total revenue as a result of the destruction and seizure of Azovstal and Ilyich Iron and Steel Works of Mariupol, as well as the closure of logistics channels for sea exports, the Metallurgy sector reduced its share of the Top 1,000 companies' revenues by 6.3 percentage points to 7%. The share of revenues of retail trade (-2.1 pp), transportation (-1.5 pp), construction (-1 pp) and food industry (-0.9 pp) also decreased over the past two years.
The leaders of growth in revenues in 2021-2022 were companies in the following sectors of the economy: Energy (+5.3 pp), oil and gas (+5.1 pp), coal mining (+1.2 pp), and wholesale trade (+1 pp). The IT sector also increased its share in total revenues by 0.8 pp from 0.5% to 1.3%.
The regional structure of the total revenue of Ukraine's largest enterprises has also changed: Kyiv managed to show the maximum increase in total revenues of large businesses by 572 billion UAH (+1.2 percentage points). However, in relative terms, the share of revenues of Top companies registered in the west of the country increased the most during martial law. Thus, the share of companies' revenues from Lvivska oblast increased by +1.8 percentage points to 4.6% over the past two years and Volynska – by +0.8 percentage points to 2.6%.
In contrast, the share of large companies in Donetska oblast's revenues decreased by 3.8 pp. The downward trend, for obvious reasons, affected Dnipropetrovska (-1 pp), Mykolaivska (-0.6 pp), and Kharkivska (-0.4 pp) oblasts. Due to the occupation, for the first time in the ranking of the largest companies, there are no companies from Luhanska and Khersonska oblasts, most of which are controlled by enemy troops, and companies from the frontline areas have relocated to safer regions of the country.
How to analyse the market on your own?
You can use YC.Market for independent market analysis with the option to generate lists of companies by the main NACE code, region, city, registration date and further analysis of revenue and other financial indicators. This is a new tool for easy and quick market analysis created by YouControl. It will help you find the largest companies in Ukraine in each economic sector researched according to the selected criteria.
Conclusion
Each of Ukraine's largest companies from the Top 1,000 list generated at least 1.25 billion UAH in revenue in 2022. They mainly belong to the energy and agriculture sectors with low levels of processing. Large businesses in the metallurgy, transportation and trade sectors generated a high share of revenues in the war year. The most significant number of Top companies remain de jure concentrated in Kyiv, although de facto some of their assets may be located in other regions. As business activity shifted to the centre and west of Ukraine after the full-scale invasion, Lvivska, Volynska, Zhytomyrska, Vinnytska, Cherkaska and Rivnenska oblasts and Kyiv significantly increased their share of the Top 1,000 companies.
In the regional structure of the Top 1,000 rankings, the role of companies from the eastern industrial and southern agricultural regions has decreased due to relocation, occupation or physical destruction by the aggressor. At the same time, big businesses in missile-affected but unconquered cities in the territory controlled by the Armed Forces of Ukraine – Kharkiv, Odesa, Zaporizhzhia, and Mykolaiv – still managed to survive and remain among the most profitable businesses during the challenging war conditions.
The war year of 2022 had a negative impact on Ukraine's largest companies. Despite the nominal growth in total revenues, inflationary processes offset it entirely, and business activity has declined in real terms. The most significant decline was observed in the revenues of large companies in the metallurgy, retail trade, motor vehicle trade, transportation, construction, and nonmetallic mineral product industries. However, some industries even managed to increase their revenues. Ukrainian companies' revenue growth is observed in the energy, oil and gas, coal mining, agriculture, wholesale trade and information technology sectors.
Calculation methodology
To improve the quality of the study, YouControl analysts first cleaned the official financial reporting data set from legal entities with non-commercial types of legal forms. Then, we eliminated erroneous records for some companies, including small businesses, which probably arose from filling out financial statements in units instead of the standard thousands of UAH. After that, the companies were ranked in descending order of revenue from product sales. As a result, the ranking of the Top 1,000 largest companies in Ukraine as of 2022 was formed.
The resulting sample was supplemented with additional information in the YouControl analytical system, including each company's cities and regions of registration, their legal status, registration date, and main NACE code. According to the latter, each company is assigned a generalised sector of economic activity marker corresponding to the purpose of the analysis.
To ensure that a significant part of the information on sectoral affiliation is not lost in the aggregation process, the data on the main type of economic activity was additionally checked on official websites and other open sources to clarify the actual specialisation of each company included in the survey sample.