
Financial analysis based on open data
доктор економічних наук, фінансовий аналітик YouControl

The key to a company's successful development is awareness of its financial position and competitive environment. Financial analysis has become a standard workflow for identifying trends, patterns, strengths and weaknesses in a company's financial position, operations, and profitability.
With the rise of open data, financial analysis has become more accessible than ever before. Open data refers to publicly available data that anyone can access, use, and share.
What is financial analysis, what data can be found in open sources, and how to interpret it? Read about it in the article by Roman Kornyliuk, Doctor of Economic Sciences and financial analyst at YouControl.
What is financial analysis?
Financial analysis is selecting, evaluating and interpreting financial data and other economic information to formulate an assessment of a company's current and future financial status and activity. Financial analysis is usually based on the company's financial statements to make appropriate business decisions.
The general accounting reporting system as a data basis for financial analysis consists of two subsystems:
- Financial statements, which belong to the public (open) information category, provide for standardised periodic reporting and relative transparency. Its primary users are external, including counterparties, customers, creditors, investors, and others
- Management reporting, which is confidential and proprietary information, contains detailed plans and regular reports for internal users: owners and top managers of the company who make strategic decisions. Although management reporting is a source for financial analysis, it is beyond the scope of our topic, as it does not fall into the category of open data.
Financial statements in the open data format
On May 28, 2021, the State Tax Service published the financial statements of Ukrainian legal entities in the open data format for the first time. The disclosure of financial statements in the open data format is guaranteed by the Law of Ukraine "On Access to Public Information", and the Law "On Accounting and Financial Reporting" also stipulates that companies' financial statements are not confidential information. However, de facto, during the martial law period after January 24, 2022, the deadlines for submitting financial statements were extended, and the 2021 data sets were not made public regularly in 2022, which made it difficult for users to have full access to financial information. Nevertheless, some financial reporting data can be found on companies' official websites and open data aggregators.
The primary source for financial analysis is open data as financial statements forms published by companies, in particular, the Balance Sheet (Form 1), the Income Statement (Form 2), the Cash Flow Statement (Form 3), and the Statement of Changes in Equity (Form 4). Therefore, financial analysts need to have a basic understanding of accounting to interpret the structure of these basic and mandatory reports.
Balance sheet or Form 1
Balance sheet (Form 1) is a report on the financial status of an enterprise that reflects its assets, liabilities and net worth as of a specific reporting date.
The balance sheet consists of 3 key elements:
- Assets are resources controlled by the company.
- Liabilities are funds that the company owes to its creditors and other counterparties.
- Net Worth (Owner's Equity) is part of the company's assets after deducting its liabilities.
Main equation of the balance sheet
The main equation of the balance sheet:
Assets = Liabilities + Net Worth
A Balance sheet is a kind of financial snapshot of a company's status at a certain time.
Based on these Balance sheet items, the following important absolute financial indicators can be calculated as part of the financial analysis:
- Net Working Capital = Current Assets – Current Liabilities
- Net Debt = Total Debt – Cash Flow
- Enterprise Value (EV) = Market Value + Net Debt
- Interest Bearing Debt = debt on which interest is accrued
- and other consolidated absolute indicators of financial status.
Let us recall the main parts of the balance sheet, some of which will be used later in the calculation of relative financial indicators (ratios).
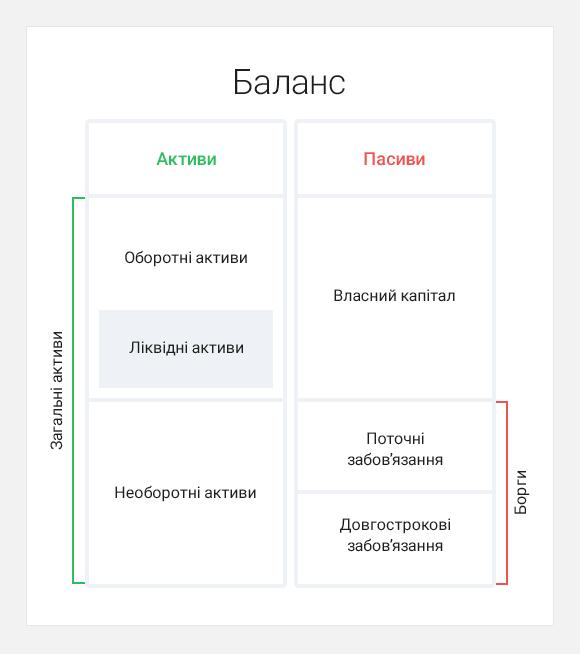
Fig. 1. Structure of the company's balance sheet
Income Statement or Form 2
Income Statement (Form 2, Profit & Loss Statement, P&L) reflects the company's financial results for a particular time (year, quarter).
The Income Statement consists of 3 key elements:
- Revenues are earnings from the supply or production of goods, services, or other activities that reflect the company's key operations.
- Expenses are expenditures related to the supply or production of goods, services or other activities considered the company's core business.
- Other income is revenues from unusual activities outside the company's core business.
As a result of arithmetic operations on various income and expense items, the Income Statement reflects the following crucial financial performance indicators of the company:
- Gross Profit.
- Operating Profit.
- Earnings before tax (EBT).
- Profit after tax (Net profit/loss, Net Income).
Based on the items in Form 2, the following absolute indicators are calculated:
- EBITDA (Earnings Before Interest, Taxes, Depreciation and Amortization) – earnings with interest, taxes, depreciation, and amortization added back.
- EBIT ( = EBITDA minus Depreciation and Amortization) – earnings before interest and taxes.
- EBT ( = EBIT minus Interest on Debt) – Net Profit before tax
- Net Profit ( = EBT minus Income Tax) – Net Income, Net profit/loss.
Indicators of Form 2 items are often used as input data for the calculation of many relative financial indicators, in particular: Net Debt/EBITDA (leverage level), EV/EBITDA (level of undervaluation/overvaluation of the company), EBITDA/ha (profitability of agricultural holdings), and others.
Unlike the Balance sheet, which shows the company's status as of a specific date, the Income statement reflects financial flows: the financial results obtained over a long period. Form 2 objective is to show where the undistributed profit in the liabilities of the Balance sheet came from.
Form 3 – Cash Flow Statement
Cash Flow Statement (Form 3) is a report that reflects cash inflows and outflows during the reporting period as a result of operating, investing and financing activities.
The main components of the Cash Flow Statement are the following:
- Operating cash flows are changes in the amount of cash resulting from transactions that reflect the company's common activities.
- Investing cash flows. Investing activities include purchases and sales of long-term assets and other investments that are not cash equivalents.
- Financing cash flows reflects the components of debt formation and repayment and dividend payments.
Thus, the Cash Flow Statement shows the change in the amount of monetary funds for a certain period. The result of Form 3 – the amount of cash and cash equivalents as of the reporting date – is also specified in the Balance sheet (Form 1). Thus, the purpose of Form 3 is to show where the money in the assets of the Balance sheet came from.
Statement of Changes in Equity
Statement of Changes in Equity (Form 4) is a report that reflects changes in the company's equity during the reporting period. It is relatively less commonly used as a data source for financial analysis.
Try YC Market for financial analysis
YC Market is the most complete source of open data on Ukrainian companies
Summary
When using financial statements in the research process, analysts should remember that even a perfectly executed financial analysis can be erroneous if it is based on incorrect data from improperly prepared financial statements. However, even poor-quality financial statements are better than no statements at all. Analysts know from experience which items in financial statements are most often adjusted by accountants and why. Analysts use additional sources of information to verify and complete financial statement data.
Read more about using financial statement data for analysis in part two of this series of posts for the YC Market Blog.